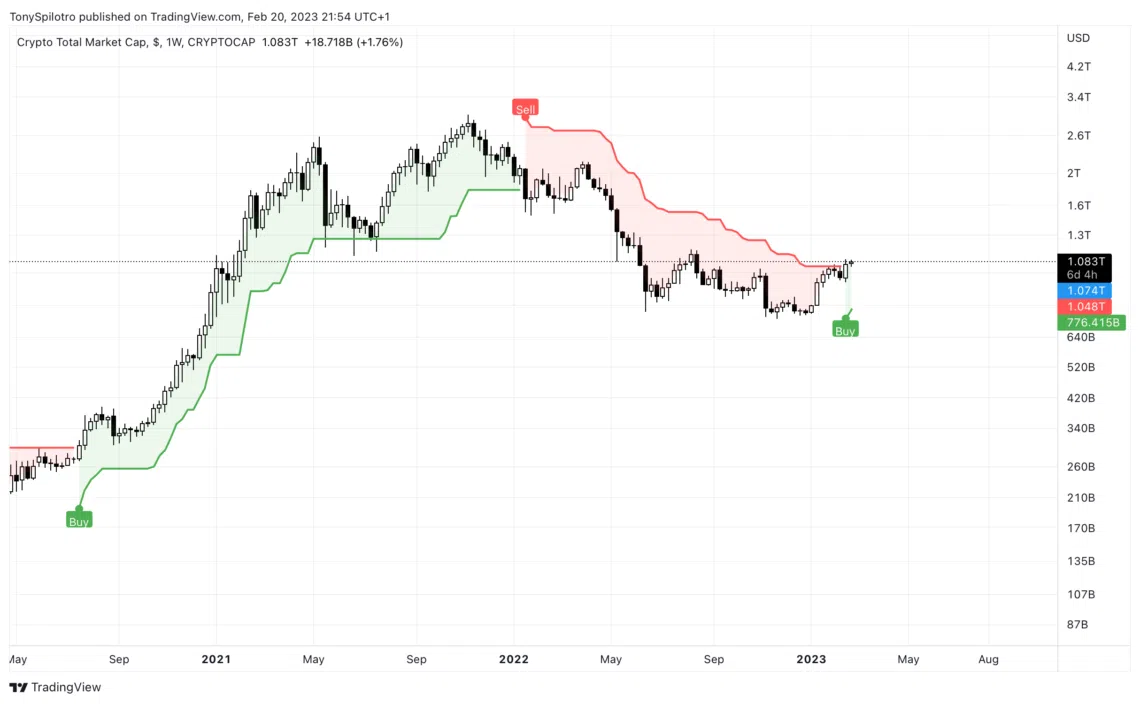
By analyzing charts and patterns, as well as looking at different indicators, traders can get a better idea of which direction a cryptocurrency is likely to go and if it is overpriced or undervalued.
One such tool that analyzes these charts and patterns is the SuperTrend. Developed by Olivier Seban, the SuperTrend offers straightforward buy and sell signals, allowing users to quickly identify shifts in the direction of the trend.

While its trend-following prowess can sometimes lag behind actual price movements, the SuperTrend provides an invaluable resource for those looking to capitalize on market volatility.
It follows the price action on the chart, shifting upward if the market is bullish and downward if it is bearish.
The brand new newsletter with insights, market analysis and daily opportunities.
Let’s grow together!

As such, it can be used as part of a trailing stop-loss strategy, allowing traders to manage their risk in a more efficient manner.
Evidence of bullish trends by SuperTrend
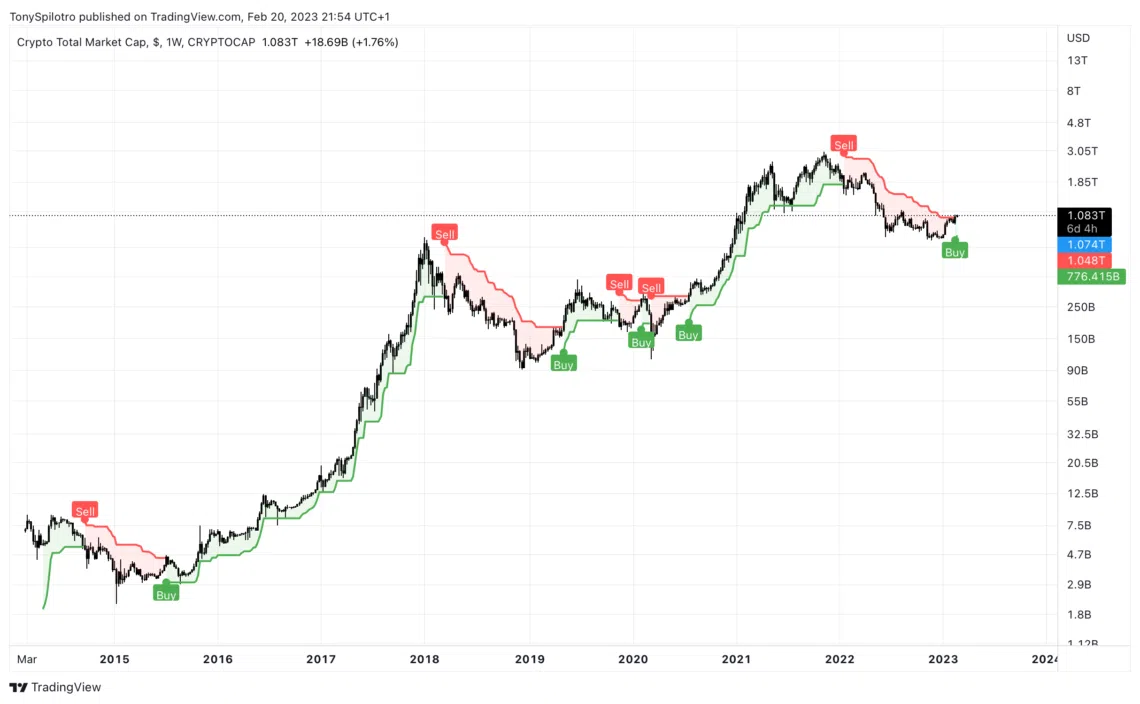
For the first time since July 2020, the crypto market is on a strong upward trajectory, having rocketed from less than $300 billion to the current market value of nearly $3 trillion. This extraordinary growth was predicted by the SuperTrend tool and is a sure buy signal for traders.
An impressive tool for market forecasting
Despite the uncertainty of the painful 2018 bear market bottom time, the SuperTrend was unfazed and identified the shift from bear to bull without fail.

An even earlier example of the SuperTrend’s accuracy was the weekly analysis during the 2015 bear market bottom, which confirmed the bear-to-bull transition with only one false alarm following the 2018 buy signal.
Furthermore, the sudden Black Thursday market crash due to the COVID pandemic caused an immediate loss. However, if the trading tool had been used to set a trailing stop loss, the losses could have been mitigated in some way.
Could the SuperTrend indicator be the sure way to determine bullish or bearish trends now and in the future?


