Summary:
As Bitcoin bulls strive to propel the value of BTC to reach $24,000, it’s not just the king of cryptocurrencies that stands to benefit. Fellow heavyweights like LTC, AVAX, APT, and FTM may also see their monthly wins magnified.
BTC to the moon!
Bitcoin has rallied nearly 40% so far in January 2023.
Following the initial surge, a sharp drop is predicted, leaving only the most determined holdouts. Subsequently, the dip will also reveal if Bitcoin has a bottom or not. If the bottom is secure, numerous alternate coins may soon outshine Bitcoin in the near future.
The brand new newsletter with insights, market analysis and daily opportunities.
Let’s grow together!
Let’s examine the Bitcoin charts and altcoins that standout to determine which ones could continue their upward trajectory in the coming days.
BTC/USDT
Highs
Since January 25, 2023, Bitcoin has been maintaining its position above $22,800, a clear indication that bulls are eager to transform this benchmark into a solid support.
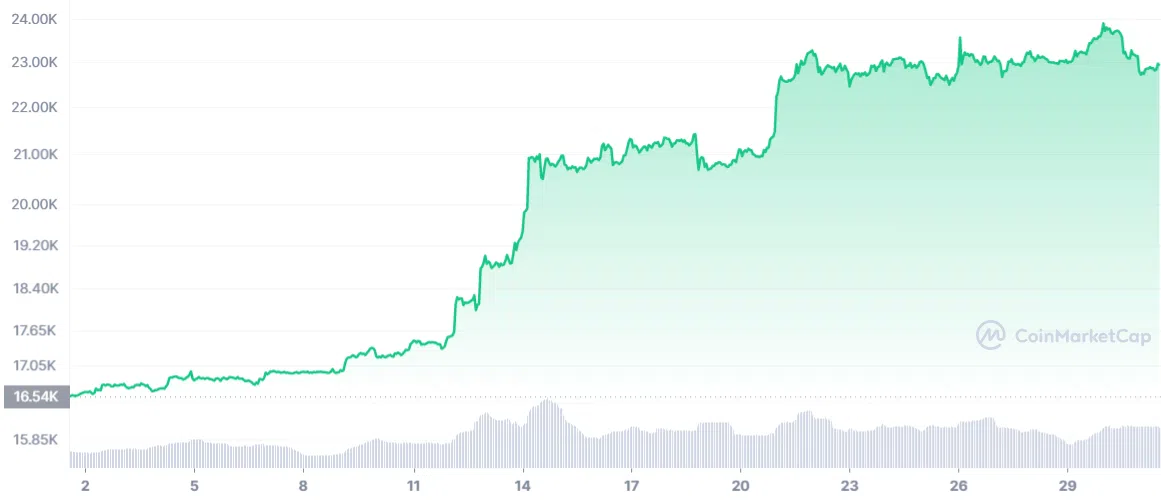
The upward 20-day exponential moving average ($21,558) reveals that the bulls are in control. Yet, the relative strength index (RSI) soaring into overbought territory warns that the near-term rally may have reached its peak.
Should buyers push the price above $23,816, the BTC/USDT duo may set its sights on $25,211. This level, however, may prove to be a formidable obstacle.
Lows
The 20-day EMA represents a critical line in the sand for the bulls. If this level is broken, the pair could fall to $20,000.
Moreover, the RSI on the four-hour chart is showing signs of a negative divergence, hinting that buyers may be losing their grip. Nonetheless, to reclaim their dominance, bulls must rise to the challenge and push the price above the $23,816 resistance, igniting the next phase of upward momentum.
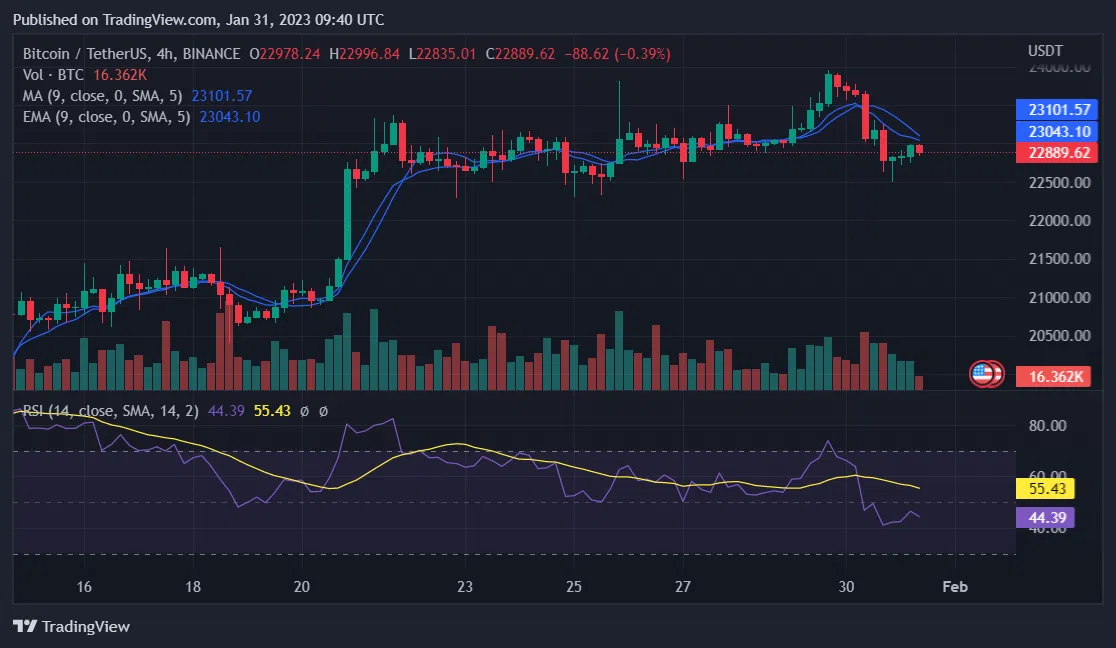
On the flip side, if the overhead resistance proves too much for the price, bears may attempt to pull it below the moving averages.
TL;DR: A minor cushion awaits Bitcoin at $22,715, but should it give way, the pair may revisit $21,480.
LTC/USDT
Highs
Litecoin has been on a steady upward climb for days now. After a short pause, buyers reinvigorated the upward momentum by pushing the price past the $92 resistance. This signifies that the upward trend remains robust.
The LTC/USDT duo may charge forward towards the psychological benchmark of $100, where bears may attempt to construct another barrier.
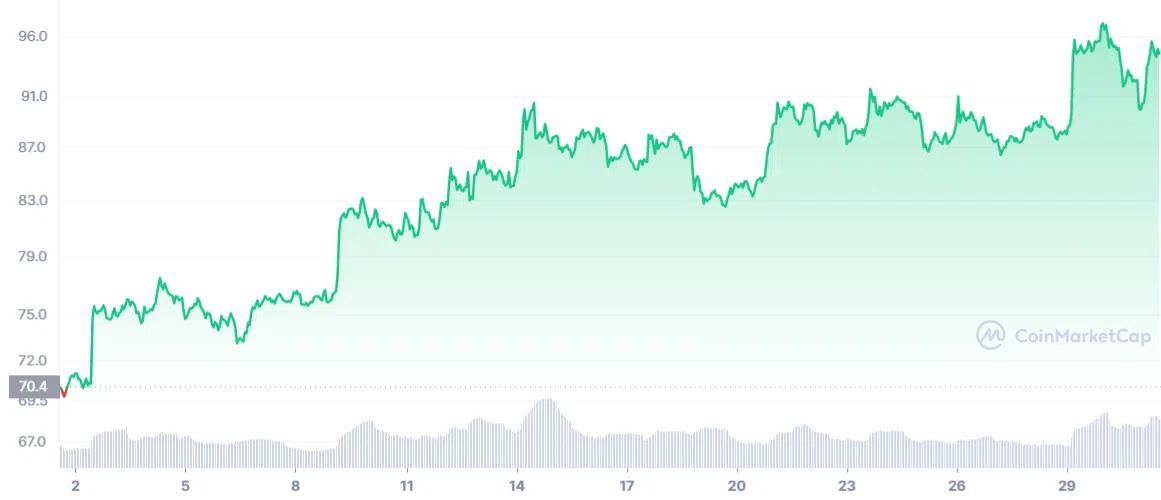
If the bulls hold strong at this level, the pair may forge ahead towards $107. With the upward-trending 20-day EMA ($86) and the RSI hovering near overbought territory, the advantage currently lies with the buyers.
Lows
In spite of that, such an optimistic outlook may crumble if the price takes a downward turn and breaches the 20-day EMA. In such a scenario, the pair may sink to $81 and potentially even to $75.
The decisive break and sustained close above $92 signals that the period of consolidation favored the buyers. If the bulls persistently keep the price above $92, the pair may soar towards the estimated target of $98.
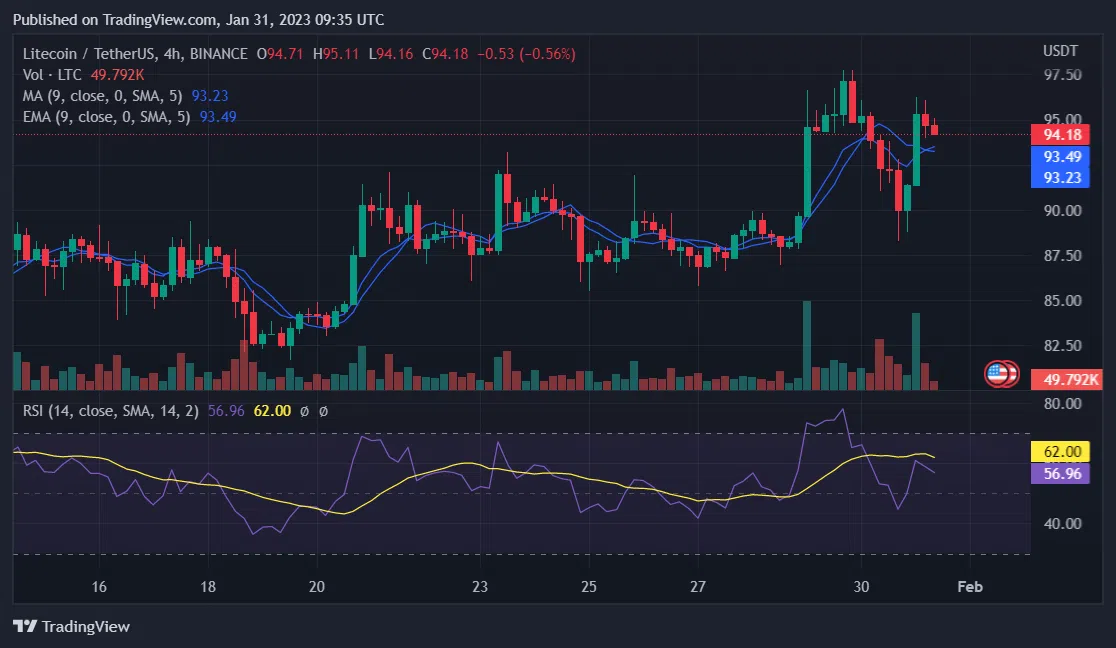
However, the bears are expected to counter with their own strategy: to push the price below the key level of $92 and ensnare the bullish traders.
Once successful, the pair may plummet to $86. A breach at this level could shift the advantage towards the bears.
AVAX/USDT
Highs
Avalanche (AVAX) rose past the resistance line and reached a high of $22 on January 28, 2023, breaking through the overhead barrier.
Bulls are charging for more gains as the AVAX/USDT pair continues to climb towards $22, overcoming the bears’ attempts to slow their progress.
The reluctance of the bulls to take profits signals a potential break through the overhead resistance, leading the pair towards a potential upward sprint towards $30. There may be a small obstacle at $24, but it appears the bulls are poised to clear it with ease.
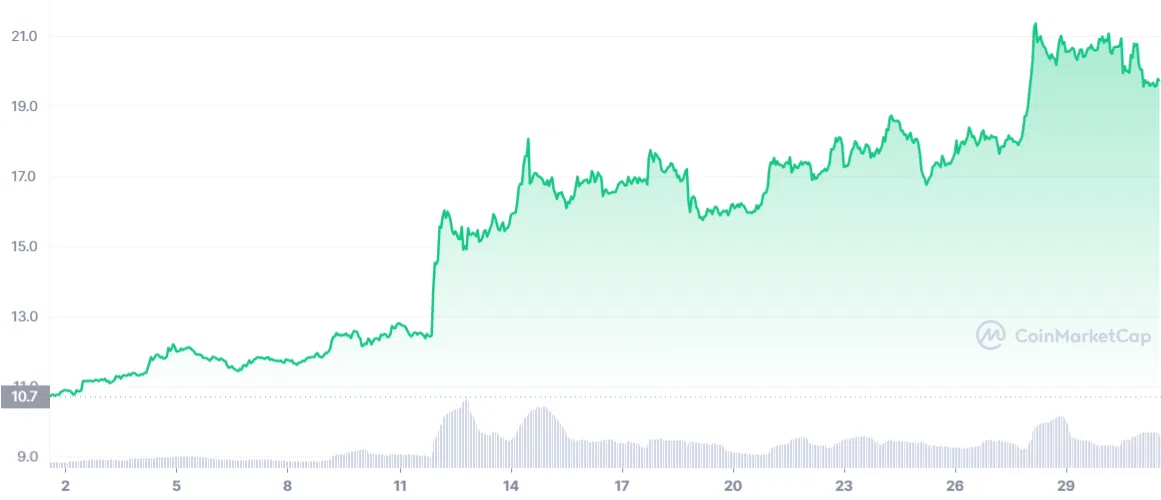
A possible outcome is that the price takes a dip and revisits the resistance line. If the bulls defend this level and push the price up, it could mean that the resistance line has now become a support. Consequently increasing the chances of breaking past $22.
On the other hand, if the price plummets below the 20-day EMA ($17), the bears may seize the reins of power.
The current dip near the 20-day EMA on the four-hour chart may provide the perfect launching pad for the bulls. Their aim? To push the AVAX/USDT pair past the $22 resistance and potentially reach for new heights at $24.
Lows
Assuming that the price plummets and lingers below the 20-day exponential moving average (EMA), the bears might tighten their grip and call the shots. A break from this support could pave the way for a resurgence from the bears.
The upward momentum and sure progression suggest that Aptos may keep cruising in the same direction for a while.
The APT/USDT pair’s upward journey hit a road bump at $20.40 on January 26, 2023, but the bulls are quickly jumping in to steady its fall at $16.62. Should the bulls steer the price back above $20.40, a new wave of momentum may launch the two tokens towards $24.
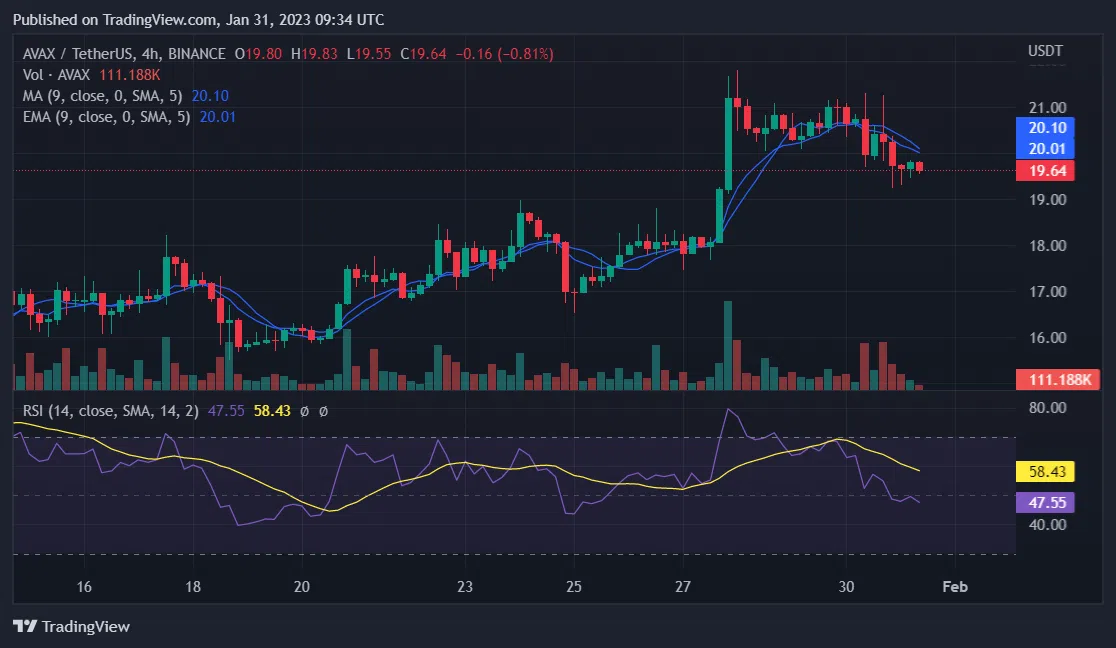
RSI’s extended stay in overbought territory may threaten the optimistic outlook for APT/USDT. If the bears succeed in pushing the price below the support at $16.60, the pair may experience a dip to $14.57 and possibly even further to the 20-day EMA at $12.23.
The RSI on the four-hour chart hints at a potential downturn, with a negative divergence forming. Should the price drop beneath the 20-EMA, the 50-SMA may become the next target for the pair’s downward trajectory. This support level will be crucial to keep an eye on, as a breach could result in a drop to $12.
APT/USDT
High
Aptos has been soaring on the wings of success lately.
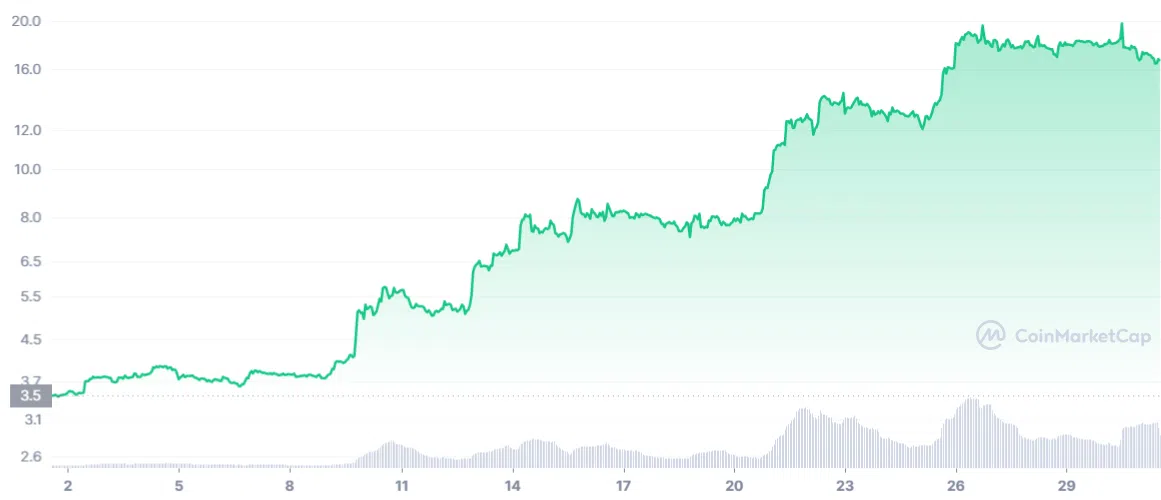
The APT/USDT duo hit a roadblock at $20.40 on January 26, but the bulls are valiantly attempting to steady its descent at $16.62. They are pushing the price to pass $20.40 and igniting the next upward surge to reach $24.
Lows
A recent prolonged stay in overbought territory for the RSI brings with it the risk of a sudden drop. If the price falls below $16.60, it could lead to a drop down to $14.57 and potentially even to $12.23, the 20-day EMA.
The four-hour graph displays an ominous formation – a negative divergence on the RSI. Presuming the price tumbles beneath the 20-EMA, the pair might embark on a journey to test the steadfast 50-SMA. This crucial support level bears close scrutiny, for if it should buckle, the pair’s descent could reach as low as $12.
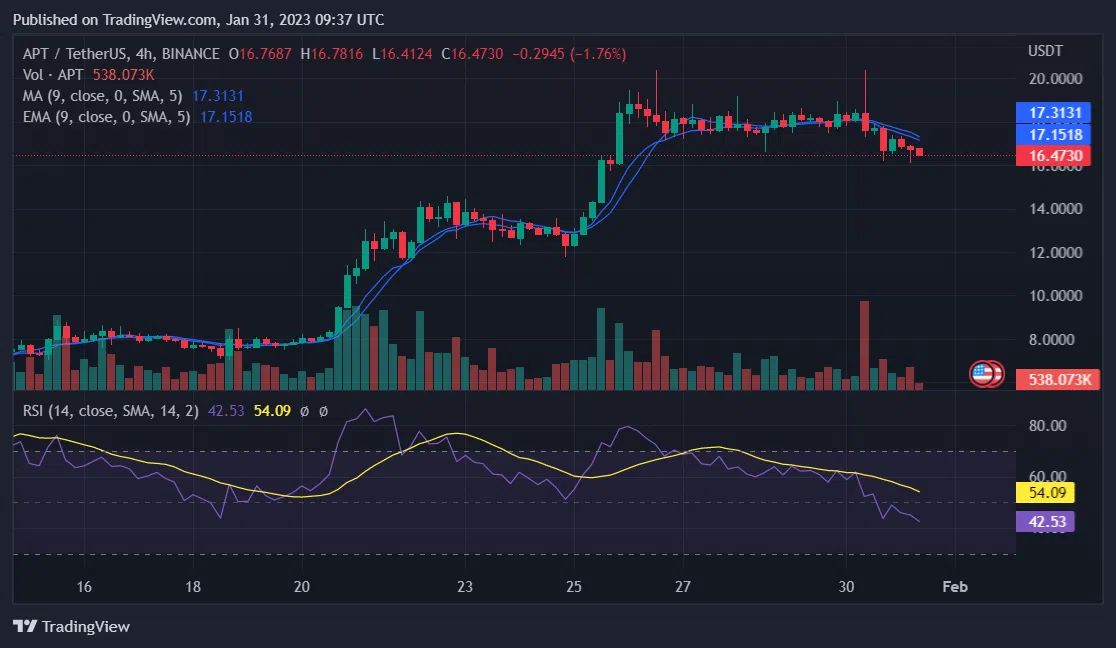
On the other hand, if the price takes a turn for the better and soars above $20.40, it would signal that the bulls have regained control. This could render the developing negative divergence on the RSI null and void, igniting a resurgence of the upward trend.
FTM/USDT
Highs
The bulls are dominating the game as Fantom has been on a thrilling climb after breaking out of its downward trajectory. The speed of the recent surge shows that the buyers are making bold moves.
The indicators are telling a tale of bullish dominance.
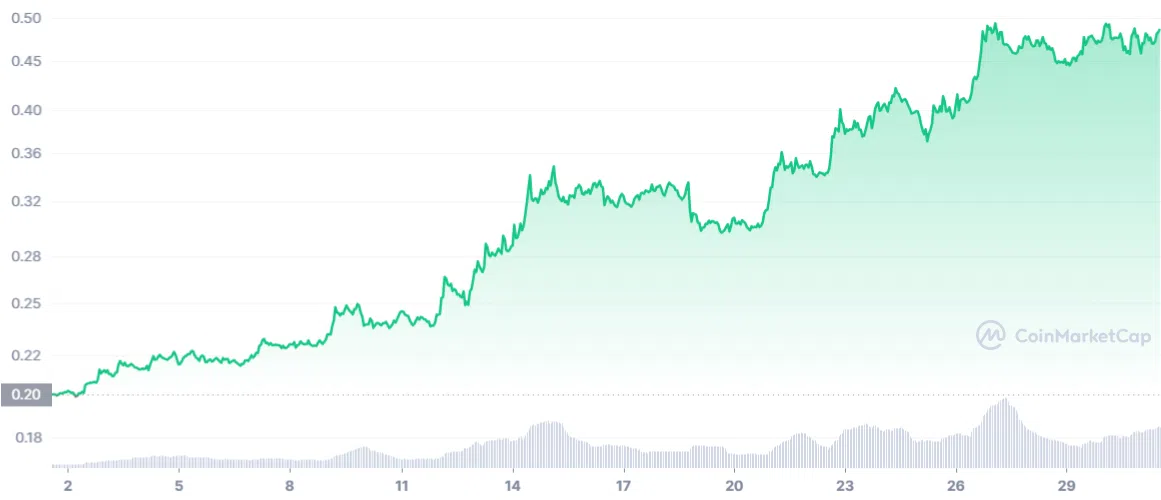
In the midst of a mighty upswing, corrections are brief as bulls scoop up every small dip. The bears are attempting to hinder progress near the $0.50 psychological barrier. Nonetheless, if the bullish forces overpower this barrier, the FTM/USDT pairing could soar to new heights, reaching $0.56 and then possibly soaring even higher to $0.63.
Lows
Beware of a potential dip, as history has shown that after soaring upward, abrupt drops can follow.
A close below $0.43 could send the FTM/USDT pair tumbling towards the 20-day EMA at $0.37, marking a crucial moment for investors to observe. A break below this level could indicate that the recent upward trend may have temporarily come to an end.
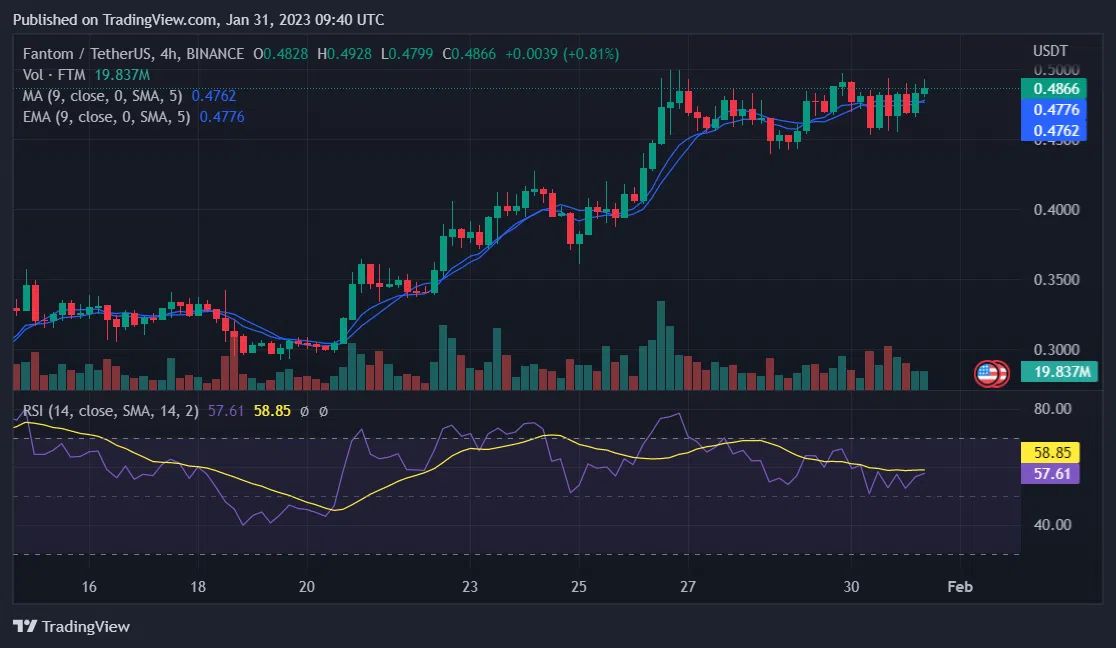
The bears may be plotting a disruption, aiming to drive the price below the 20-EMA. This level serves as a crucial watchpoint in the short term, as a breach could lead to a potential decline towards the 50-day simple moving average. If this support fails to hold, the FTM/USDT pair may drop to $0.36.
In conclusion
Bitcoin is currently on an upward trend, with multiple altcoins in tow.
Why?
A sudden rise in the market, led by a top player (in this case, Bitcoin), can mean strong traders are buying big. Meaning, investors think the recent sell-off was too much or that the value of the market is now a good deal.
Moreover, if you consider the Fibonacci Extension, BTC is currently riding on the fourth wave, towards the fifth wave. Experts predict a dip to happen shortly after for the leading token at no less than $18,500.


