Using technical analysis, CryptoQuant analysts named five key indicators of Bitcoin’s future growth. In addition to signs of a new growth cycle, there is also mildly bad news from Glassnode — there is a high level of sales, which prevents the continuation of Bitcoin price growth.
Good news
Based on technical analysis, CryptoQuant analysts have identified five on-chain indicators that signal an early bull market cycle. In their opinion, we are witnessing the early stages of a market reversal to growth.
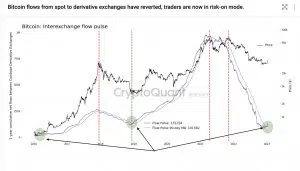
- Flows between spot and derivative exchanges
Bitcoin movements from spot to derivative exchanges show that investors have entered “risk-on” mode, signaling the beginning of a new bull cycle. This indicator shows the positive sentiment of investors.
The brand new newsletter with insights, market analysis and daily opportunities.
Let’s grow together!
Simply speaking, spot exchanges trade real cryptocurrencies, while derivatives exchanges trade derivatives based on those cryptocurrencies (in other words, a virtual representation of that crypto). Trading on derivatives exchanges is potentially more profitable but also more dangerous, so the increase in the volume of derivatives trading is a sign of increased optimism among traders.
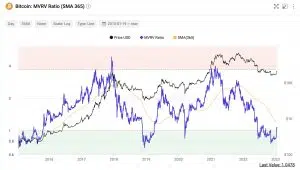
- MVRV Indicator
MVRV ratio, which is above 1 (1.07), is close to its 365-day moving average (orange line), showing that Bitcoin is about to start a new uptrend.
The MVRV Ratio is calculated by dividing the Network Value (market cap) by the Realized Cap. Market Capitalization is a measure of the current valuation of the asset, i.e., a combined value of the entire coin set in USD terms. Realized Capitalization is a measure of the combined USD values of all coins at the points when they were received (moved). The MVRV ratio statistically shows if the BTC price is undervalued or overvalued, signaling potential for growth.
Its reversal in January shows a strong increase in the likelihood of Bitcoin rising in price.
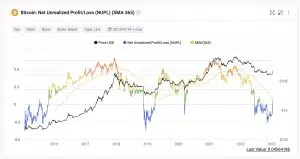
- NUPL Indicator
NUPL (Net Unrealized Profit/Loss), the average profit margin of Bitcoin holders.
NUPL is an on-chain indicator that shows whether the market is in a state of profit or loss. It is created by simply dividing relative unrealized profits by relative unrealized losses. Negative values suggest that the market is in a state of loss, while positive values suggest that it is in a state of profit.
Like the MVRV ratio, the NUPL shows that Bitcoin is about to start a new uptrend.
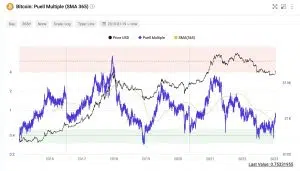
- Indicator Puell Multiple
Indicator Puell Multiple is showing a shift to a positive trend because bitcoin’s price has passed its 365-day moving average to the upside for the first time in a significant way since November 2020.
The Pewell Multiplier is the ratio of daily coin issuance (in USD) to the annual average of daily coin issuance, which is a leading indicator based on profitability. The term “leading indicator” means that this indicator allows predicting future profitability based on this ratio pattern.
On the chart, you can see how this indicator was falling all crypto winter, but in January, there was a positive reversal of this value.
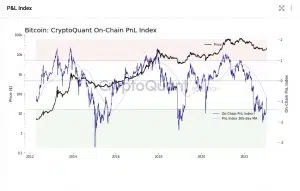
- P&L Index
CryptoQuant’s P&L Index combines the MVRV ratio, NUPL, and LTH/STH SOPR into a single Bitcoin value indicator. The P&L Index is a composite indicator that includes data from the above indicators and even more. It tries to take into account many different factors that show the health of Bitcoin.
The PnL Index is close to giving a buying signal for BTC, which happens when the index (dark purple line) crosses its 365-day moving average (light purple line). For this indicator, the final market reversal may happen somewhere around $24-25k for Bitcoin, and we are already close to that point.
Bad news
Despite positive signals, caution should be maintained as the market is still very fragile:
- CryptoQuant concludes its analysis with the following: according to the PnL Index, Bitcoin appears to be expensive in the short term, posing some risks of a pullback. That means the price increased too quickly in the previous week, which will likely lead to a temporary price decline.
- Glassnode analysts report high sales of Bitcoin when it reaches about $23,000; in most cases, it’s miners fixing their profits and taking advantage of the favorable price. Such massive sell-offs have so far prevented Bitcoin’s price from continuing to rise above that level. The market operates on a balance of supply and demand, and if sales fully cover demand, growth is impossible.


