Contents
On February 15, we had an AMA session on Twitter with Brian, Director of Marketing at crypto analytical platform Santiment.
Here you can listen to the whole recording; here — check out Brian’s thoughts about the current market situation, and in this text, we publish an extensive guide Brian shared with us about analyzing the market for trading and investing.

What information should you follow on the market (except news)
#1 is whale activity
Generally, prices move in the direction of what the top key stakeholders are doing. Especially if it’s a large asset like Bitcoin or Ethereum.
Throughout 2020-2021, up until October 2021, we saw the addresses holding between 10 and 10,000 Bitcoin. They were absolutely exploding with accumulation, and it wasn’t a surprise that Bitcoin nearly hit $69,000 before seeing a quick correction.
The brand new newsletter with insights, market analysis and daily opportunities.
Let’s grow together!
When that correction occurred in mid-November of 2021, whales were already starting to take a profit. They started dumping about two weeks before the actual all-time high happened.
We saw the amount of supply held by them go down considerably, and that caused prices to very quickly collapse, almost like a house of cards. We no longer had those huge institutional addresses out there that were propped up.
#2 is seeing whether there’s a rising amount of daily active addresses or circulation
- Daily active addresses are the unique amount of addresses interacting on the network.
- Circulation is the unique amount of coins circulating on the network.
Those are two very big ones to show whether the asset is actually gaining usage over time, and usage is what generally causes prices to move up and down. If there isn’t enough usage and things are getting too stagnant, that is a signal that the price might be in trouble because it’s simply not circulating at the rate that it should be in order to sustain higher and higher market caps. That was what we saw in late 2021.
#3 is taking a look at average trading returns at a given time
Crypto is a zero-sum game. It may seem like either everyone is getting money or everyone is losing money at any given time, but a lot of that has to do with the various points at which people are entering and exiting the market.
For example, when you see that on the 30-day scale, Bitcoin is down 20% for the average trader, that would be a signal that you’re buying in “when there’s blood in the streets,” and that can be an advantageous strategy for you.
How to track whales’ activity
The beauty and the pain of crypto are that it’s all anonymous, and whales don’t announce that they are going to be making a big purchase or a big sell-off in three days. They just do it.
So as for tracking, usually there is a bit of lag. Still, this data is useful, and you can check it on Santiment. And if you suddenly see big purchases and the prices are staying down, that’s a bullish divergence that you can take advantage of.
If you suddenly see that they’re taking a lot of profit or dumping and the price is still looking really high, you might think that we’re in danger and want to begin protecting your assets by taking some of your profits out.
There are 2,500+ assets available on Santiment, and roughly a fifth of those are whale activity.
You also can check this data manually by keeping tabs on whale addresses and refreshing them; all of Santiment’s data is technically on the blockchain and it is public data. But by the time you’re refreshing those thousands of pages manually, the data might be irrelevant..
How to use and how NOT to use technical analysis
The problem with technical analysis (TA) is that it treats Bitcoin like it has been around for a hundred years. But the reality is that there’s just not enough of a sample size for us to look at those types of patterns over an entire asset class. That’s only been around for about fourteen years for Bitcoin.
For example, every time Bitcoin has hit $18,000, it has bounced. So now people think it never falls below. But a lot of people in 2021 thought that prices couldn’t go past $30k for some reason, and then suddenly prices blasted right up to $40k.
That’s why if you are using TA strategies, make sure you’re not just following the unanimous assumptions that everyone makes and make sure to draw your own conclusions: because the average trader loses money.
Still, it’s better to understand technical analysis to know what the crowd thinks and to make your own strategies based on knowledge of how the crowd will react. Because it’s a self-fulfilling prophecy in crypto. If you think that everyone is going to celebrate if a Bitcoin crosses $25k next week, that might be a good time to take profits because if everyone gets euphoric, then that’s usually the time when tops form.
If you’re going to look at other traders, it’s probably a lot better to look at the top traders in an asset. When people have millions of dollars to sell, it’s not going to move markets instantly but can show a cumulative sentiment of the market.
And in general, fundamental analysis and technical analysis can be used together to have a really good, optimized strategy.
Bonus: an example of token potential analysis based on Santiment’s data.
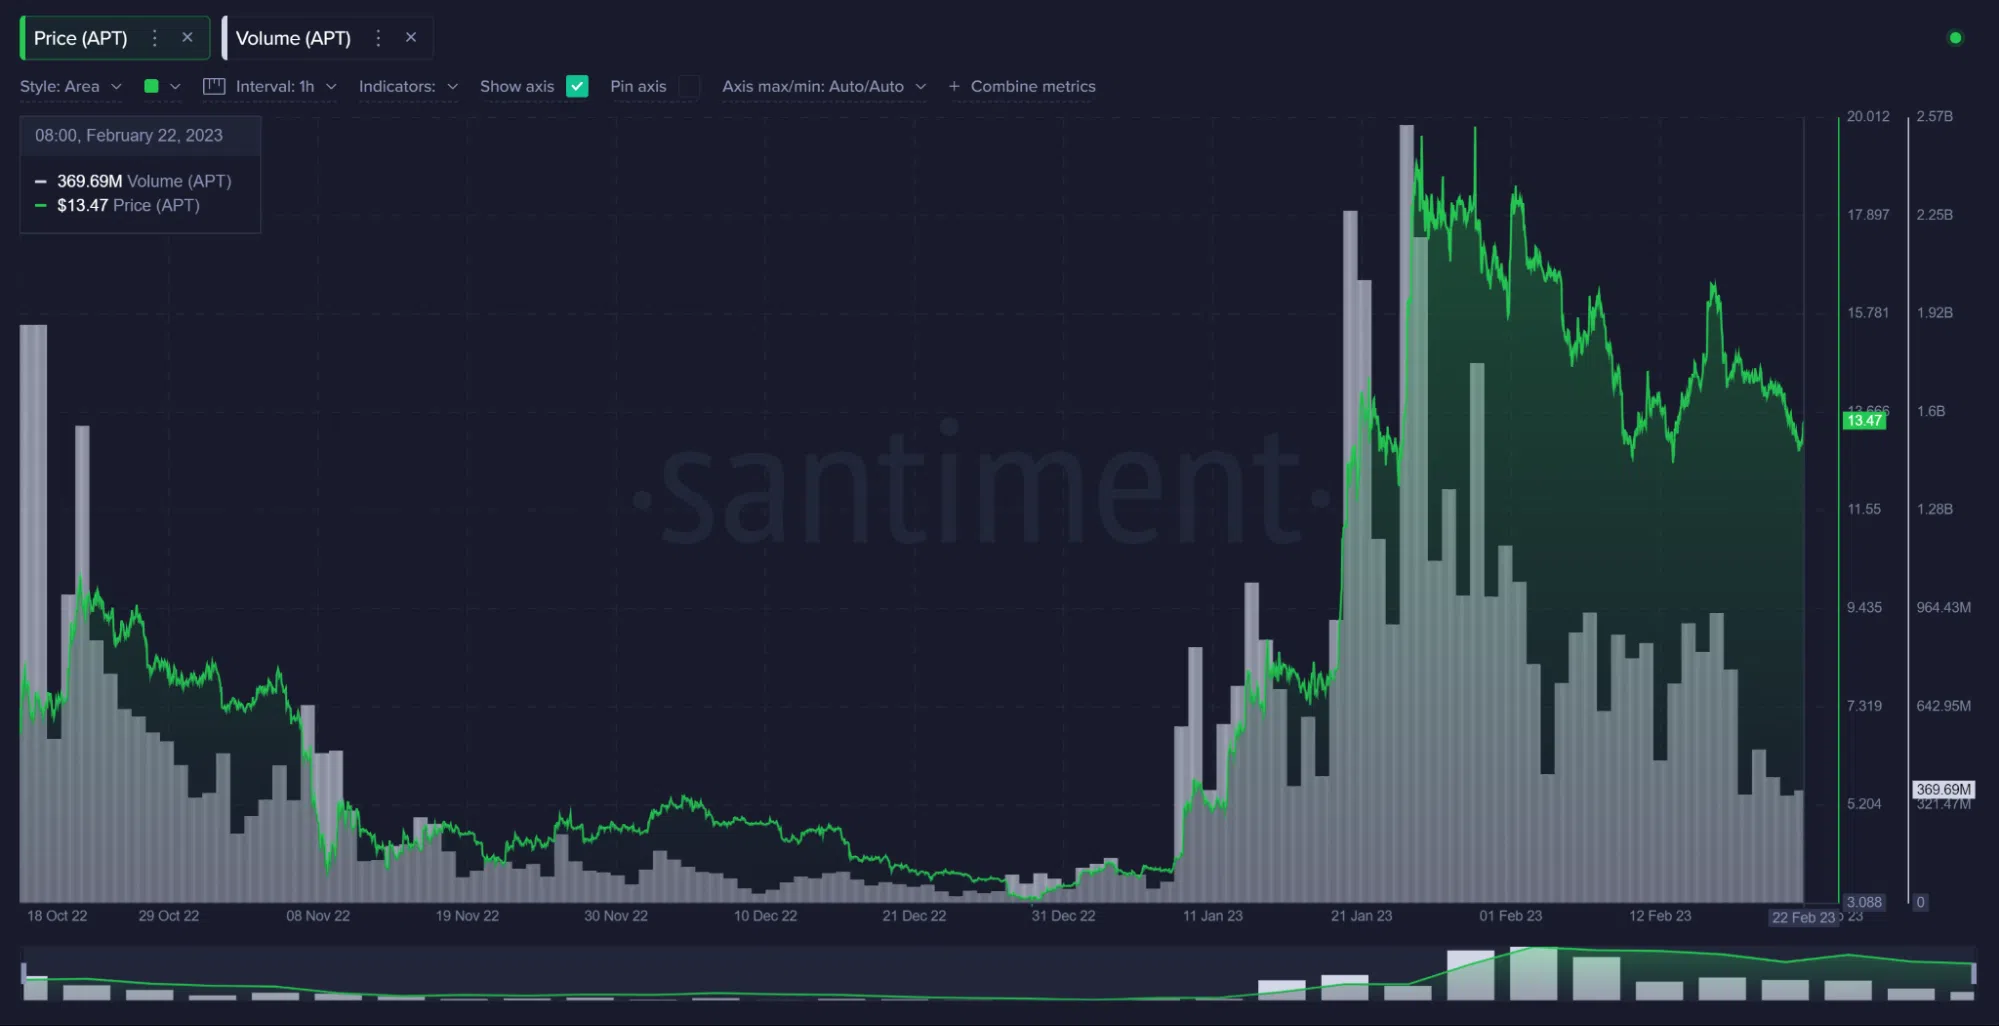
Aptos is an interesting one, so let’s take it. It’s certainly been on a major tear in 2023, and it was the biggest surprise in January for a lot of people.
Between January 8th and its peak on January 26th, Aptos’s stock price 5x and went up 404% during that time before having a correction. It’s still up at $14.80 and has really bounced ever since just in the last couple of days. That’s a good sign.
Since Aptos is not an ERC-20 asset, we don’t have a ton of metrics on it on Santiment. But we can check its volume.
One thing I do like about technical analysis is you can look at trading volume and if it’s rising to go into a price rise, that means the probability of the price continuing to go up is higher. And if the volume is going down while the price is going up, that usually means a big correction is coming soon.
That’s exactly what happened with Aptos. It ended up falling, and its volume is still way higher than it was a month ago, but it looks a little more neutral.
Now it is about 667.8K in Aptos volume per day. Before the big surge, it was only 48K. That’s a very good sign too — as far as social sentiment.

Still, Aptos is barely being talked about on Twitter, Discord, Reddit, etc., so there’s an argument that it’s actually a little bit under the radar.
So I would wait to see what trading volume and social volume do as the signal for whether prices are going to exceed the all-time high of about just under $19.


