Contents
In Summary:
The Bitcoin and Ethereum markets are experiencing a temporary setback, but it’s likely just a wave in the tide of their upward journey. Meanwhile, XRP’s price is poised tobreak from a long-term pattern, ready to ride the wave of success.
Bitcoin, a rising star
Since Nov 22, 2022, Bitcoin has been on a steady rise. Reaching new heights on Jan 13, 2023, it broke out of its previous channel and soared to a peak of $23,371 in just eight days.
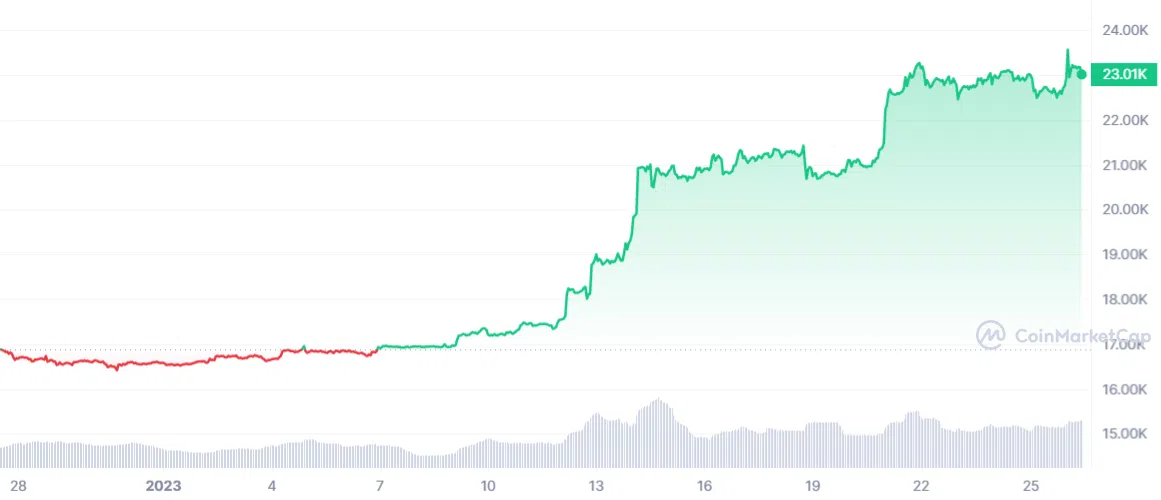
Despite this impressive climb, the tide appeared to turn as the Relative Strength Index (RSI) signaled a bearish divergence, causing a slight dip in the cryptocurrency’s value.
Furthermore, the crypto market is swarming with activity as a breakout from the channel signals the arrival of the third wave in a grand upward movement (black).
The brand new newsletter with insights, market analysis and daily opportunities.
Let’s grow together!
It appears that the next step on the journey is a dip as the fourth wave takes hold. Subsequently, this could see the price of BTC dip to newfound depths, potentially coming to rest at either $20,737 or $19,896.
A key marker to watch is the Jan. 21 high of $23,371.
Over and above that, the upward trajectory of Bitcoin can be charted like a map, with the 0.382 or 0.5 Fib retracement support levels marking the path. As the trend continues, the fifth and final wave is expected to reach a summit near $26,077, a peak forged by the 3.61 extension of the first wave (white).
Should the price of BTC rise above this cresting wave, it would signify that the retracement is finished, and a new journey upwards to $26,077 would begin.
On the other hand, the wave of $18,410 (red line) serves as a marker of caution. If the tide of the market turns, and the price of BTC falls below this red line, it would cast doubt on the bullish price analysis and signify a possible change of direction.
ETH’s price movement often mirrors that of Bitcoin’s
As the market picked up, the price of ETH broke free from a descending resistance line on Jan. 11 and soared ever higher.
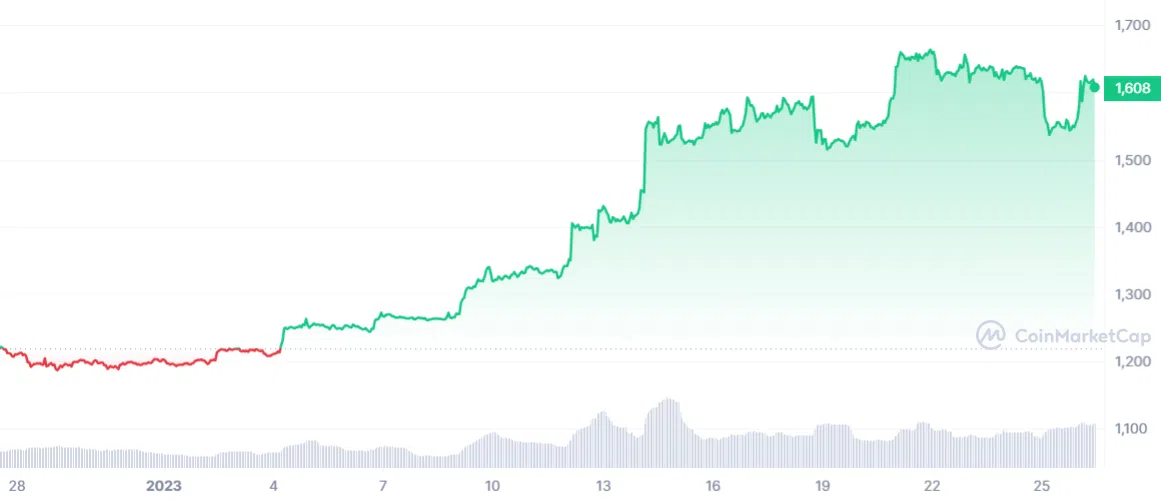
In addition, on Jan. 21, the Ethereum price reached its peak, a pinnacle of $1,679, but fell afterward as the daily RSI generated a bearish divergence (green line).
Currently, in the midst of a fourth wave, the correction could come to a close near the 0.382-0.5 Fib retracement support levels at $1,488-$1,416.
Followed closely by wave five, which is expected to propel the Ethereum price above the Aug. 2022 high of $2,030.
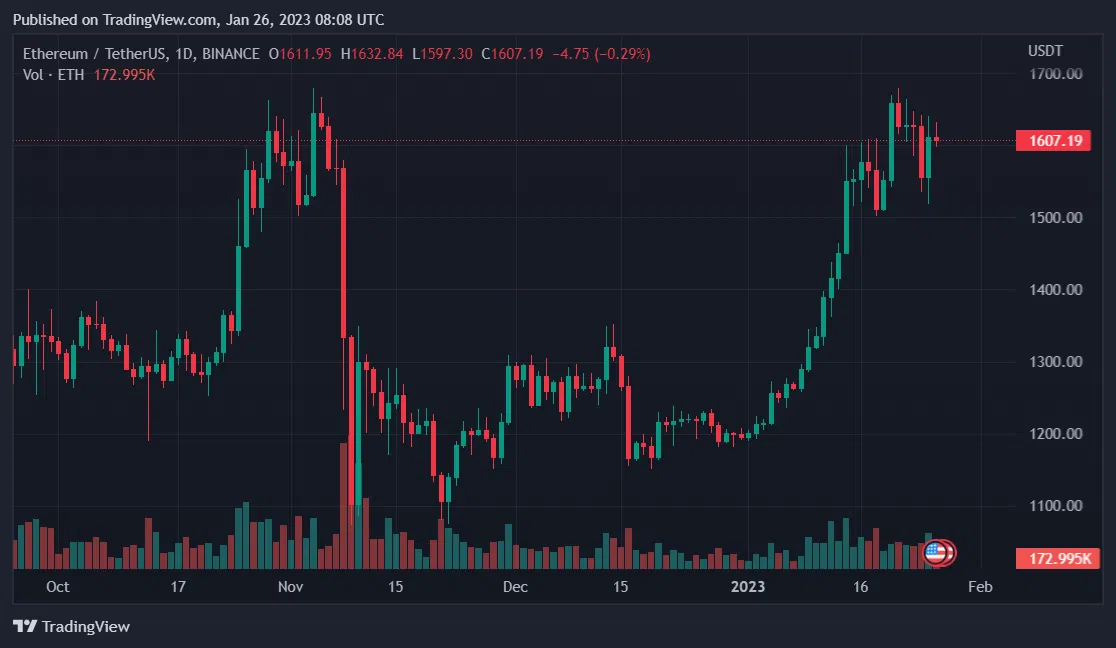
Ethereum price also has a marker to watch. The wave (red line) at $1,352 serves as a warning. If the tide of the market turns and the price of ETH falls below this red line, it would cast doubt on the bullish outlook and signify a possible change of direction.
XRP tries to break free
Third on our list is XRP price, which has woven a bullish pattern, creating a hammer candlestick (black icon) and thus initiating an upward movement. Additionally, the movement picked up momentum on Jan. 14 as it broke free from the $0.38 resistance area, and in the coming days, it validated that area as a new support.
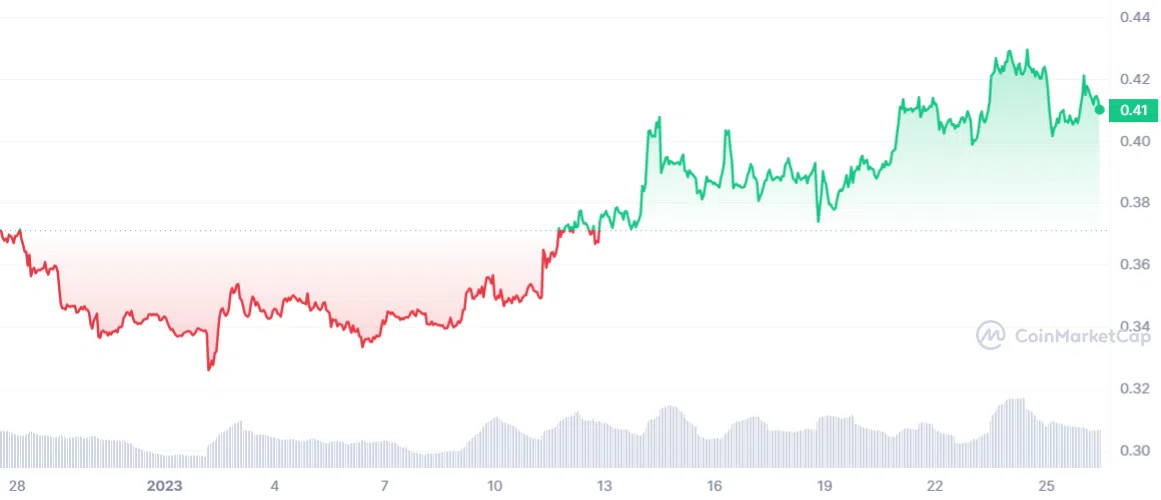
A descending resistance line, in place for 124 days, has been a formidable obstacle, but the XRP price is making an attempt to break free. If it succeeds, the price could soar to new heights, reaching the next resistance at $0.51.
Moreover, there is always the possibility of a drop. If rejection occurs, the price could plummet to $0.38, leaving investors on edge.
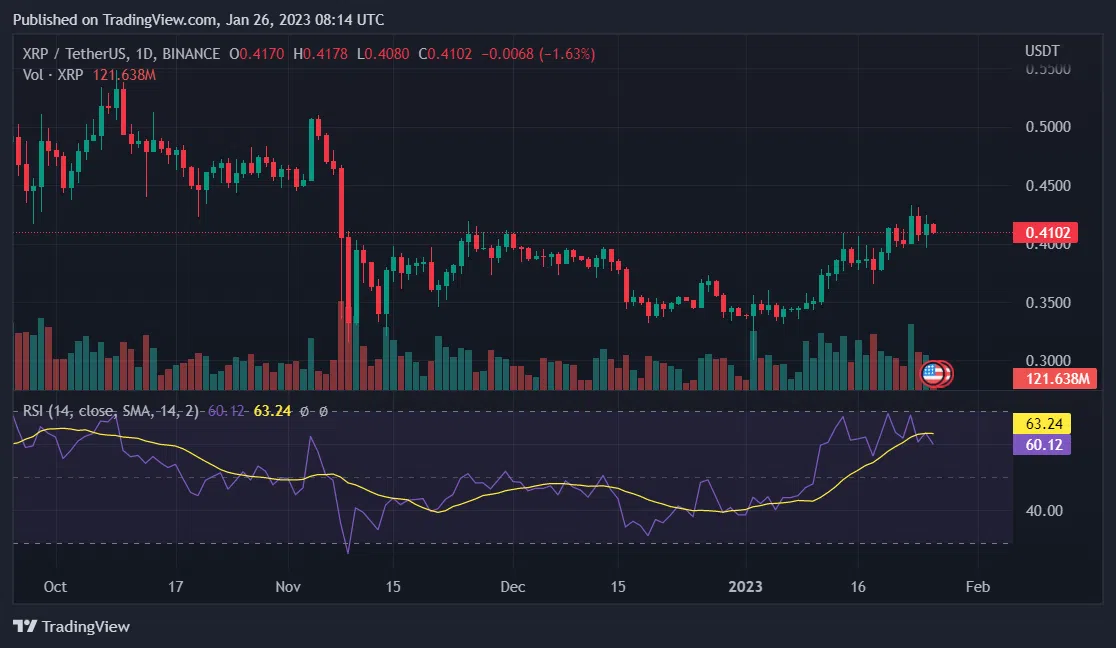
But the daily RSI is still rising and has not shown any signs of bearish divergence, indicating that a breakout is a more probable scenario.
Parting shot
In conclusion, Bitcoin and Ethereum prices are both in the midst of a retracement after reaching considerable heights in their upward movements.
XRP is currently making a valiant effort to escape the constraints of a descending resistance line.

Besides, each coin has a marker to watch and a red line to cross; if they do, it would signify a change in direction and make the trends bearish.
If Bitcoin and Ethereum prices fall below $18,410 and $1,352, respectively, the trends will turn bearish. Similarly, if the XRP price falls below the $0.38 mark, it would also indicate a shift in the market’s direction.


