Contents
SushiSwap has been on a roll, breaking free from its confined trading range and setting sail for new heights.
Price charts reveal a steadfast climb, with each peak reaching higher than the last, painting a picture of a bright and bullish future ahead.
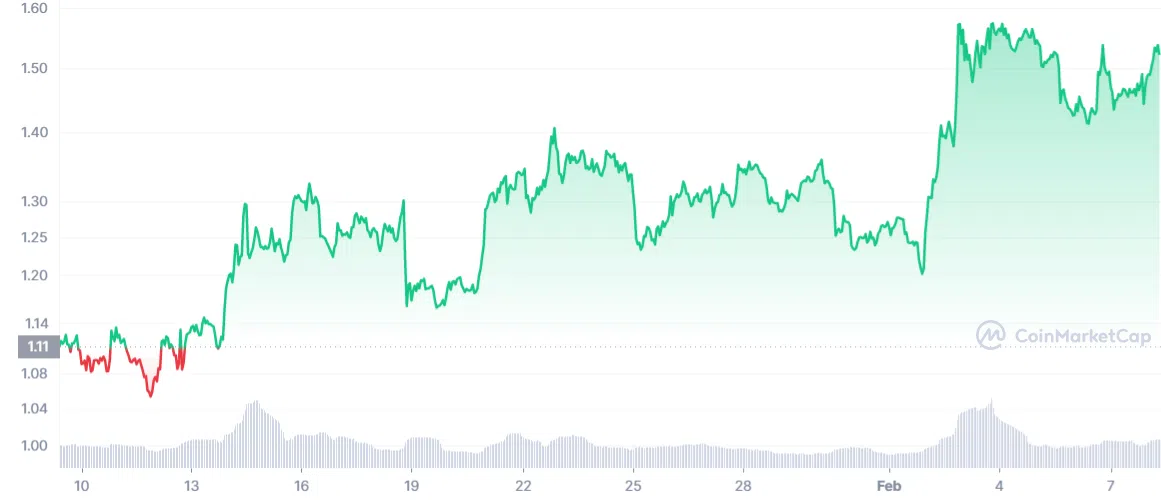
At the moment, SushiSwap dances at the price of $1.52. If it can muster the strength to breach the $1.7 resistance, the bullish trend is poised to continue its jubilant jig towards the next milestone of $2.
However, caution is advised as the $1.7 level may prove to be a stumbling block, potentially causing a momentary dip in the rhythm of the market.
The brand new newsletter with insights, market analysis and daily opportunities.
Let’s grow together!
Further, its volume has surged, now standing at $82,557,197, with a 23% increase in the past day alone.
In-depth analysis of SushiSwap
Before diving into the analysis, let’s take a look at some technical terms.
Moving Average (MA)
A technical indicator that shows the average price for a particular trade over a chosen time frame.
Moving Averages are used by investors and traders to track and identify trends by smoothing out normal day-to-day price fluctuations.
Formula: The sum of the past X periods is divided by the number of periods to find the average.
For example, using SUSHI values; a 5 day Moving Average would be; (value from Feb 01, 2023 to Feb 05 2023)
($1.19 + $1.59 + $1.54 + $1.55 + $1.44) ÷5 = $1.462
As new periods come into play, the moving average shifts forward and discards the earliest data point.
In our example above, that would be dropping the first SUSHI value for Feb 01, 2023 (in red) and adding the SUSHI value for Feb 06, 2023 ( $1.50).
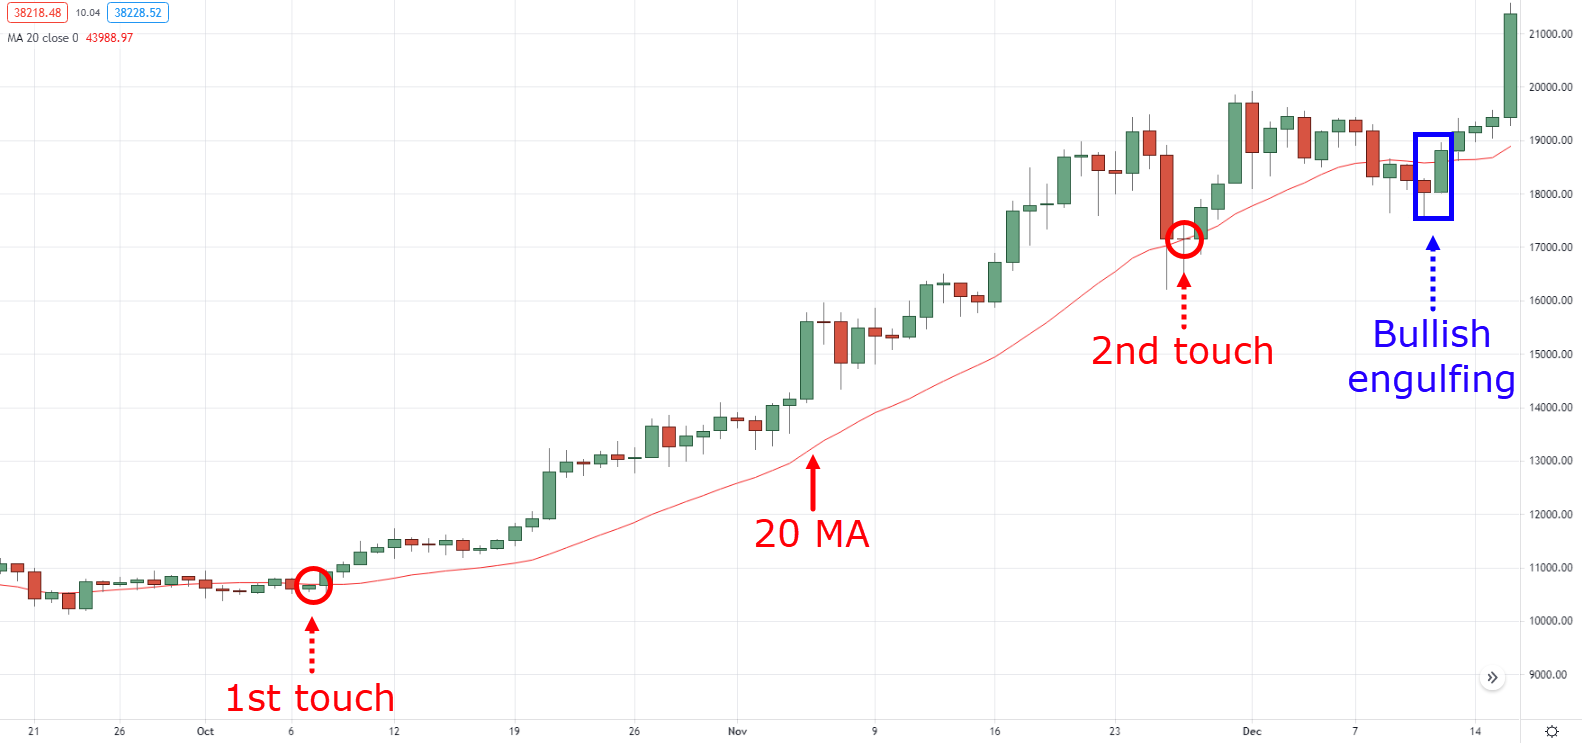
Moving Averages with short look-back periods create a bumpy ride with sharp turns. In contrast, slower Moving Averages with longer look-back periods provide a smooth, steady journey.
- Moving Averages with shorter look-back periods make quick turns.
- Moving Averages with longer look-back periods glide smoothly.
Exponential Moving Average (EMA)
Faster Moving Averages with their brief gaze into the past, tend to be jagged and rough. Meanwhile, slower Moving Averages with their extended view of history, move smoothly, like a gentle river.
With EMA, traders and investors can quickly know when to trade (buy or sell). Nevertheless, it can also increase the number of false signals.
Reasonably, savvy investors use a combination of both the MA or SMA and EMA to achieve more accurate readings.
There are various Moving Average lengths; 5, 10, 15, 20, 50, 100, 200 days and more.
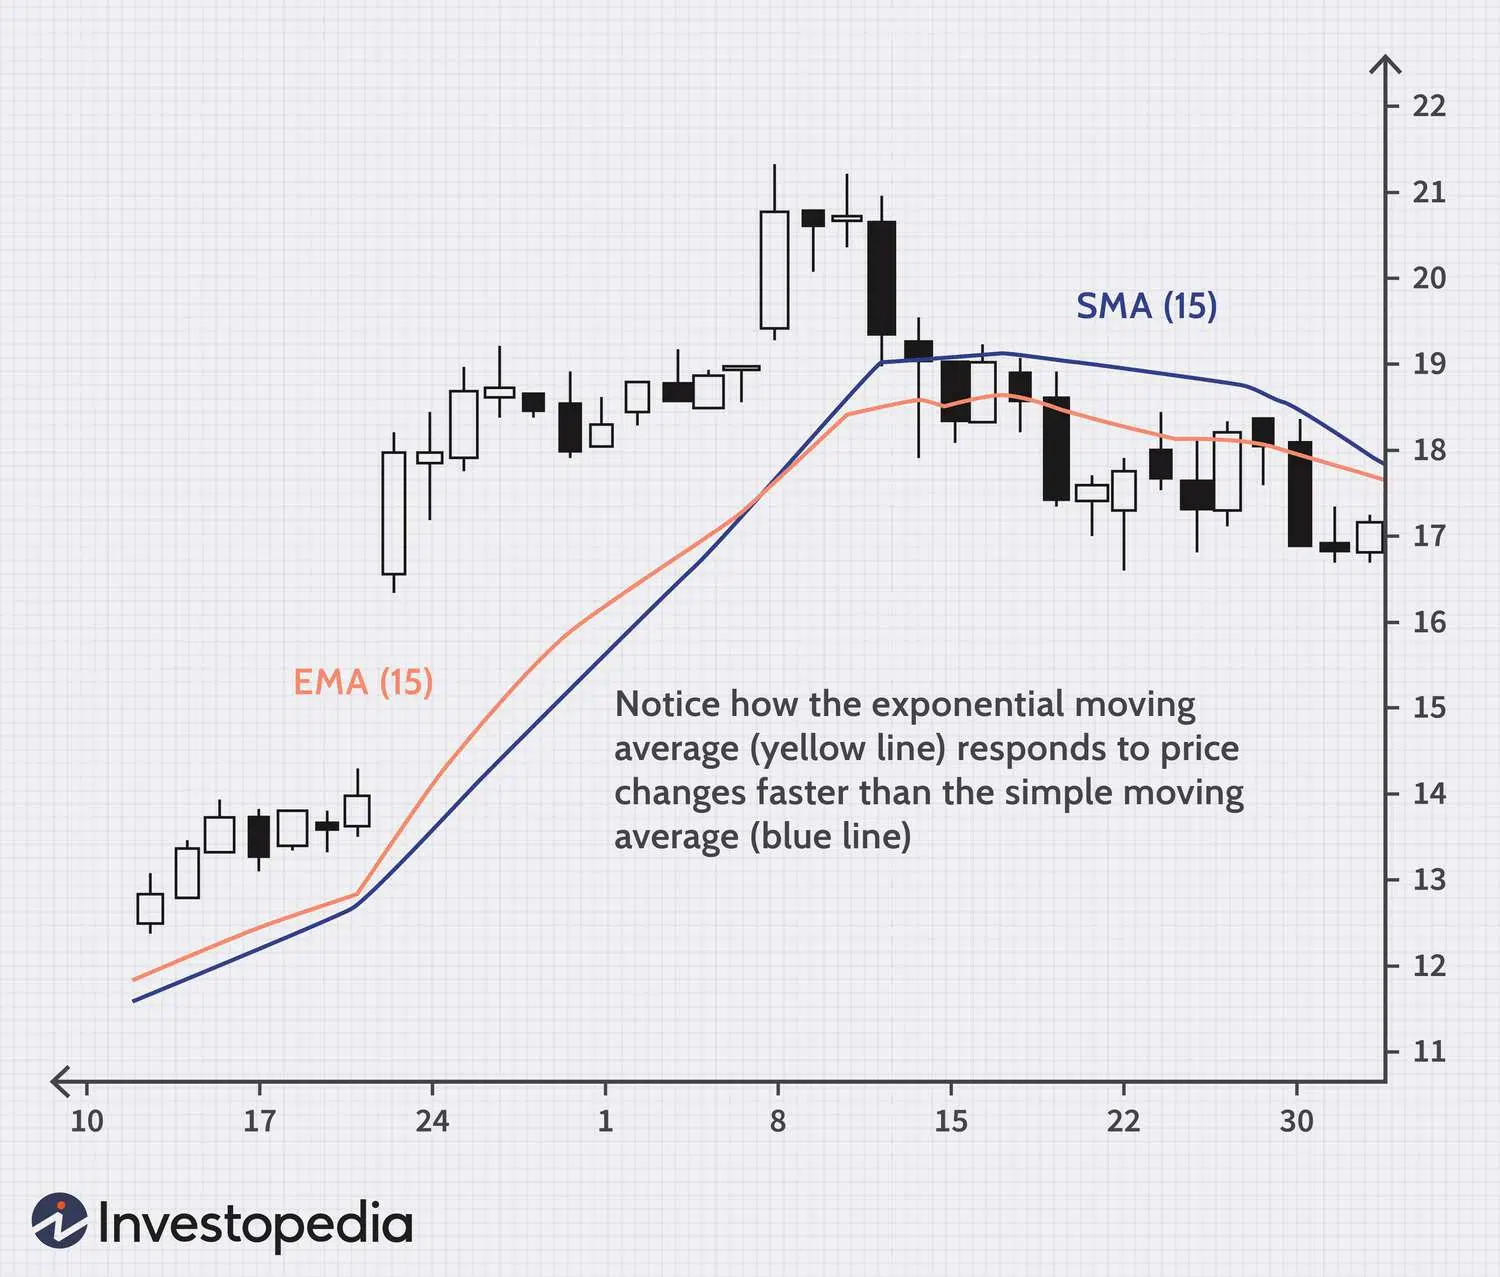
Accordingly, an EMA over the past 20 days becomes known as EMA20 or 20 EMA, more commonly the former.
Long-term investors typically rely on the 50-day and 200-day EMAs, while short-term investors prefer the 8-day and 20-day EMAs.
NOTE: All these definitions are used in trading, so they will come in handy when you’re ready to invest in any cryptocurrency.
Moving Average Convergence/Divergence (MACD or MAC-D)
Along with MA and EMA, the MACD, or Moving Average Convergence/Divergence, offers a helping hand in monitoring momentum and uncovering trends. This tool provides a visual representation of the bond between two EMAs (Exponential Moving Averages) of a security’s price.
For optimal results, the MACD is often used with daily periods and the commonly accepted configuration of 26/12/9 days.
- MACD Line: Is accompanied by the Signal Line, which is a 9-day EMA of the MACD.
- Signal Line: Plotted above the MACD and serves as a prompt for buying or selling.
Thus, traders can choose to invest in the security (such as SUSHI) when the MACD line crosses above the signal line and make a move to sell or short when the MACD line crosses below it.
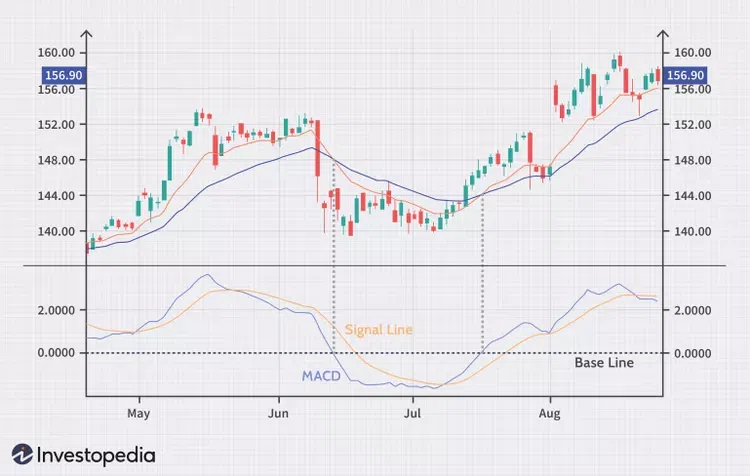
The MACD indicator can be deciphered in multiple ways, including crossovers, divergences, and sharp rises and falls. These are some of the most popular methods.
Look out for these and more definitions in an upcoming article.
Relative Strength Index (RSI)
The Relative Strength Index, or RSI, is a cleverly crafted indicator in the world of technical analysis that measures the might of a security’s price performance. By evaluating the speed and extent of recent price changes, the RSI helps determine if a security is overvalued or undervalued.
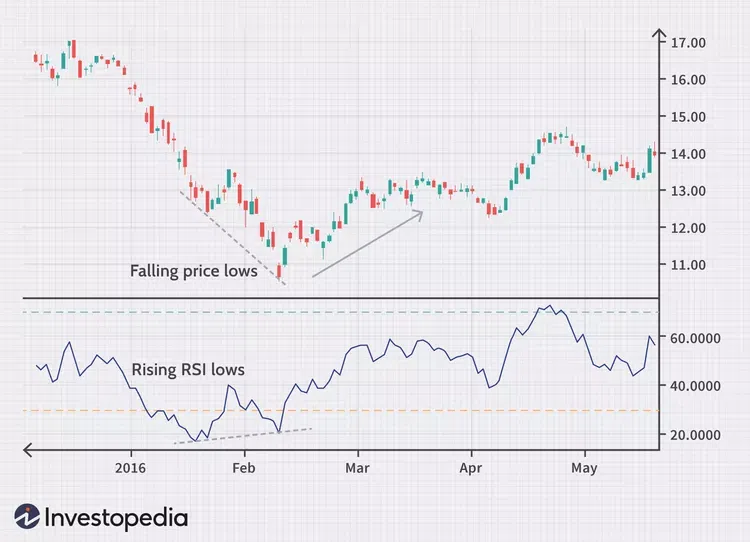
Typically, the RSI is portrayed as a line graph, also known as an oscillator, that dances along a scale ranging from 0 to 100.
As a rule of thumb, if the RSI crosses 30 on the chart, it signals a positive outlook (bullish), while a cross of 70 signals a negative one (bearish).
OR, in other words:
- A value of 70 or higher suggests a security is overbought or overvalued and may be due for a correction or trend reversal.
- Meanwhile, a reading of 30 or lower suggests it is undervalued or oversold.
What does the MA, EMA and MACD spell for SUSHI?
So, the technical analysis reveals an upward trajectory as SUSHI’s price rises above the EMA20. Plus, the MACD alludes to a bullish demeanor trading above the zero level.
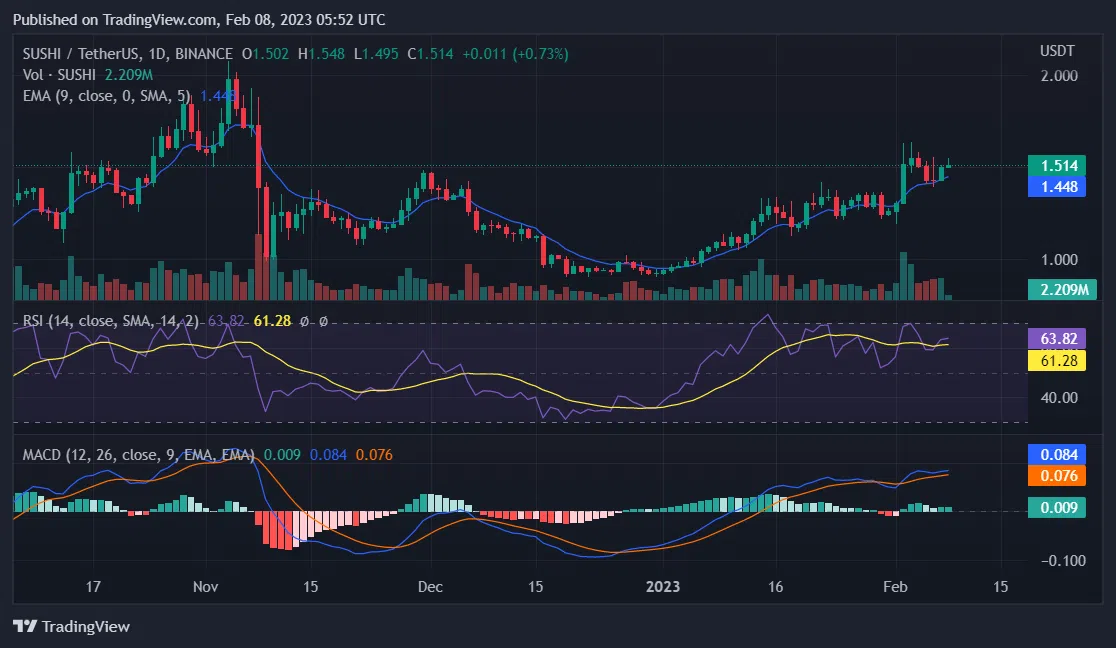
Additionally, the RSI has hit a high note, moving into overbought territory and hinting at an upside performance in the near future.
An analysis of SUSHI/USD on both the 4-hour and hourly timeframes paints a picture of a bullish market that’s holding strong.
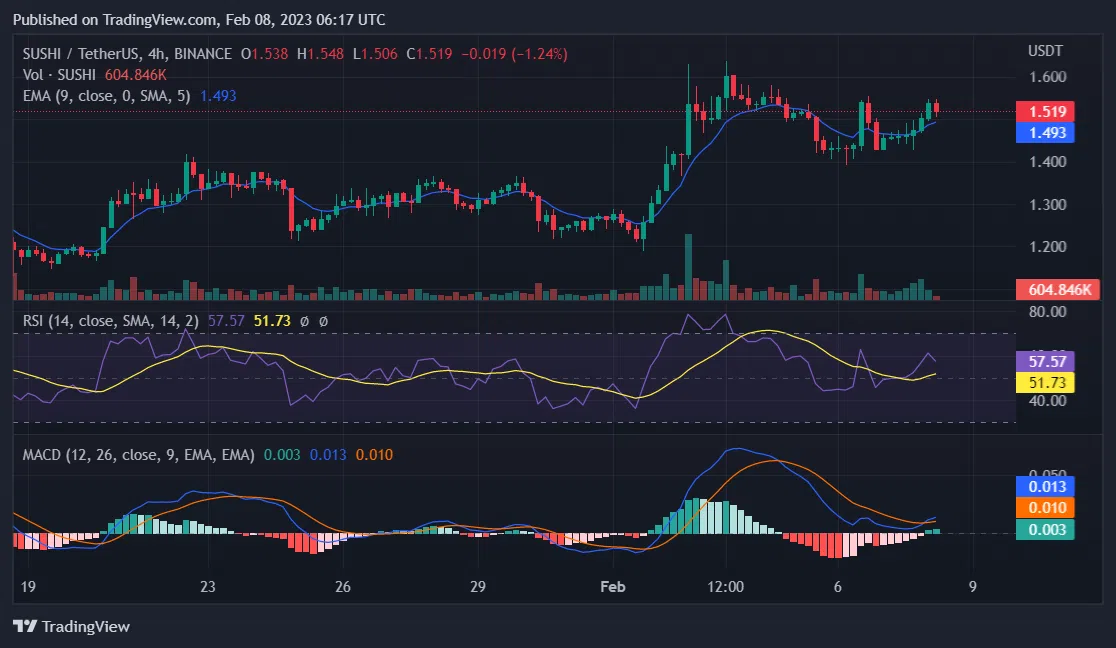
The price has ascended above the EMA20, and the MACD continues to surge ahead with a positive energy.
Although, the RSI on both the 4-hour and hourly charts is currently hovering near the 70 mark. This means that SUSHI may need to catch its breath before attempting to scale the $1.7 wall and reach its next destination.
In conclusion, investors should be on the lookout for a possible pullback, as a formidable resistance at the $1.7 level could impede SushiSwap’s ascent.


