How to analyze the crypto market by yourself? We have selected the three most important indicators that show the general mood of the market at any given moment. These indicators will help you not only understand the market’s trend but also calm you down by looking at the behavior of other major market players.
HODL Index
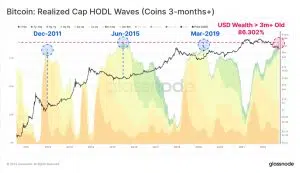
According to Glassnode, the HODL metric, showing the behavior of BTC holders, is now at an all-time high — assets three months old and older are at a record high (86.3% of the total dollar value). This means that despite the crypto winter and regular panics in the market, most Bitcoin holders refuse to sell out while demonstrating maximum discipline since the beginning of observations of this indicator.
This metric’s results are echoed by a very similar HODL Waves indicator: about 80% of BTC is now concentrated in the hands of long-term holders. In other words, the metric shows that those who haven’t moved their BTC for three months or longer now control 80% of the circulating cryptocurrency turnover.
The brand new newsletter with insights, market analysis and daily opportunities.
Let’s grow together!
According to both metrics, it turns out that HODLers currently make up the majority of crypto market participants, who remain optimistic about cryptocurrency’s future.
You can check the current value of this metric at this link.
The Fear & Greed Index
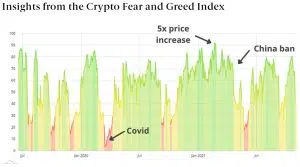
The Fear & Greed Index is a popular and very illustrative crypto-indicator that measures crypto investors’ current emotions and sentiments. Alternative.me, a software development company, has created the now-popular Fear and Greed Index for BTC.
The index is based on multiple data sources to produce an automatic score from 0 (extreme fear) to 100 (extreme greed), which indicates the overall mood of the cryptocurrency market.
Bitcoin Fear and Greed Index — based on the core idea that cryptocurrency investors tend to be collectively volatile and emotional, which allows us to express the degree of market instability in a specific number metric.
You can check the current value of this metric at this link.
Network Value to Transactions ratio (NVT)
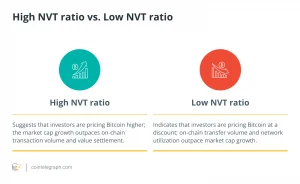
The NVT indicator is a kind of analog of the most crucial P/E indicator for the stock market, but only for the cryptocurrency market.
However, Bitcoin is not a security, and the category “profit” is not inherent to it at all. The authors of this indicator tried to solve this problem by replacing the EPS indicator with the value in US dollars flowing through the bitcoin blockchain, calling this indicator “Network Value.”
Thus, the formula for the “cryptocurrency analog of P/E” took the following form:
The market capitalization of Bitcoin / The volume of on-chain transactions (in USD)
You can check the current value of this metric at this link.
Conclusion
Many other indicators allow you to understand what is happening in the market based on facts rather than emotions for more accurate actions. Most indicators are pretty understandable for an ordinary investor without specialized education, so it is helpful to know and use them.
We have given as an example only three of the most famous indicators. At this link, you can find many other metrics (if this topic interests you).


![first-name[1] - buidlbee](https://buidlbee.com/wp-content/uploads/2022/09/first-name1-300x232.png.webp)

![63589b90a0fe130b5746868f93309426[1] - buidlbee](https://buidlbee.com/wp-content/uploads/2022/09/63589b90a0fe130b5746868f933094261-300x124.png.webp)


