Ethereum charts a course for $1,800: a closer look at the reasons why
Contents
Ethereum held its ground steadfastly above the $1,600 support, mirroring Bitcoin’s bullish stance at $23,000. With a firm foundation above $1,620, ETH has recently embarked on a steady upward ascent.
Ether’s $1,650 and $1,660 resistance levels were decisively conquered, with a decisive break above a critical bearish trend line that had stubbornly lingered near $1,640 on ETH/USD’s hourly chart.
Furthermore, the pair boldly scaled the $1,700 resistance, reaching a summit of $1,698 before taking a brief respite from its upward journey.
Moreover, on Jan 18, 2023, Ethereum danced atop $1,660 and the 100 hourly moving average, nimbly navigating the markets. The coin finds itself near the 23.6% Fibonacci retracement level of its triumphant ascent from the $1,624 low to its magnificent $1,698 peak.
The brand new newsletter with insights, market analysis and daily opportunities.
Let’s grow together!
Granted, the $1,690 level presents an imminent challenge, a formidable fortress that Ether must conquer.
However, beyond lies the next great frontier, the $1,700 resistance, waiting to be breached.
Should Ether break through this barrier, it would ignite a blazing path towards higher peaks, with the $1,750 resistance as the next target. And with enough momentum, the skies are the limit, with Ether reaching for the $1,820 resistance zone, scaling new heights in its never-ending pursuit of glory.
Notably, the $1,650 zone serves as the next bastion of support, as well as the 61.8% Fibonacci retracement of Ether’s ascent from $1,624 to $1,698.
Nonetheless, if this defense falls, Ether may plummet towards the $1,620 support. On top of that, if the downward spiral continues, the $1,600 support zone may be the last line of defense against total devastation.
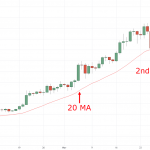
What is a Moving Average?
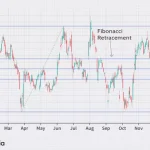
What is the Fibonacci Retracement level?
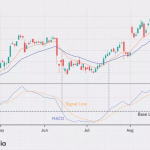
What is the MACD?
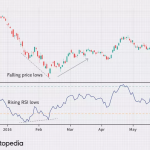
What is the RSI?
What is the Major Support Level?
What is the Major Resistance Level?
Hello, fellow crypto enthusiasts! 👋 As we embark on another week in the ever-evolving crypto…
EigenLayer, a protocol for Ethereum restaking, recently announced an airdrop plan that garnered both praise…
Keonne Rodriguez, a figure linked to the cryptocurrency mixing service Samourai Wallet, has entered a…
The debut of spot crypto exchange-traded funds (ETFs) on the Hong Kong stock market is…
Tether, renowned for its dominant stablecoin USDT, has embarked on a significant investment journey after…
Bitcoin analyst Willy Woo forecasts that the cryptocurrency industry could achieve its first billion users…